PANORO ENERGY / 2026–2030 MODEL
Your assumptions.
Panoro’s valuation.
Explore how oil prices and the return of Dussafu drilling change Panoro’s cash flow and equity value.

A pan-African portfolio.
A scenario you can test.
A scenario you can test.
Changes since v6. Added reported Q3 and October liftings and sales, revised the Q4 forecast, and reset the Dussafu production baseline to 3,600 bopd after MaBoMo restarted. Panoro trading statement ↗
Q3 and October trading figures
| Metric | Period | Reported |
|---|---|---|
| Crude liftings and proceeds | Q3 2026 | 1.481m bbl · $110.2m |
| IFRS crude liftings and proceeds | 9M 2026 | 2.127m bbl · $161.2m |
| Crude liftings and proceeds | October 2026 | 0.715m bbl · $91.2m |
| Realised oil price | October 2026 | $127.50/bbl |
| Crude inventory | 30 September | 1.171m bbl |
| Cash and gross bond principal | 30 September | $76.5m · $350m |
Reported sales through October total $252.4m. November and December sales use the existing Q4 lifting range and price assumptions. September cash and bond principal are interim balances. The model rolls cash, working capital and debt to 31 December.
SCENARIO VALUE / DILUTED SHARE
NOK 51.55
Valuation date: 31 December 2026
+69.0%
vs NOK 30.50
4 Nov 2026 reference
NHG base · NOK 51.55
A model-derived target-price proxy, before dividends. This is a dated scenario value; the workbook does not produce a current-date or broker target.
2027 oil production17.8 kbopd
2027 organic FCF$150.5m
2026 closing net debt$185.7m
Deducted in equity bridge
02 / FROM ASSETS TO EQUITY
NOK / SHAREThe valuation bridge
A SOTP-style breakdown of the workbook DCF. Values share one price deck, discount rate and valuation date.
See the USD equity calculation
The source workbook has no field-by-field NAV. Core operations are valued together; CI-27’s post-2030 cash tail is separated. CI-27 cash flows through 2030 are already in the explicit forecast.
03 / THE RESTART PATH
DUSSAFU NET BOPDDelayed barrels, changing cash flow
Your recovery schedulePre-incident reference
Drilling restart
→First oil
→Five phased wells
Monthly schedule from Dussafu tab, with 10% annual decline, a 40,000 gross bopd facility cap and Panoro’s 17.5% interest. The chart shows the production profile as new wells come online.
04 / PRESSURE-TEST THE CASE
What moves the value?
Each cell is a full model recalculation in NOK per share. The outlined centre is your active case. Select a cell to apply its assumptions.
05 / THE FINANCIAL PATH
Five years in view
USD million unless stated. Oil production includes CI-27 working-interest liquids; gas is excluded from this chart. CI-27 is equity-accounted, so its revenue and EBITDA are excluded from consolidated totals. Organic FCF includes associate capital calls.
Wait for operational evidence
Existing production has restarted. Hydraulic-unit mobilisation, a replacement-rig contract and a revised well sequence are the next operating milestones. Lower Brent hits realised sales and cash generation; delayed wells defer the growth path.
06 / UNDER THE NUMBERSBuilt on the NHG model.
Built on the NHG model.
Open about its assumptions.
The dashboard model is based on the supplied Panoro_Financial_Model_2026_2030.xlsx. The 4 November trading update is incorporated into the dashboard model. The Dussafu production forecast starts from the reported 3,600 bopd rate. Repair and drilling dates remain separate assumptions.
Read Norwegian Hidden Gems ↗Valuation method & limits
Discount 2027–2030 unlevered cash-flow proxies to 31 December 2026, add the discounted 2030 core EBITDA exit value and CI-27’s net cash through August 2034, then deduct 2026 closing net debt. Divide by 141.450832m diluted shares and translate at your NOK/USD assumption. The source core/risked research NAV midpoints (NOK 42.665 / 53.215) use different decks and remain context only; they do not drive the dashboard.
The residual is not a perpetual growth calculation. No CI-27 licence extension is assumed. Country tax pools, new-well decline curves, cargo timing and final acquisition accounting remain estimates. No new committed funding or 2029 bond refinancing is assumed.
How the restart assumptions work
First oil equals the selected drilling restart month plus your lead time. This mapping is added for the dashboard; the workbook directly controls first oil. Its three first-oil cases are March, June and October 2027. The programme phases five wells; later catch-up is allowed. ESP repair has its own month input, independent of first oil. February 2027 is the base assumption; 500 net bopd recovery is illustrative. Bourdon and Tortue are not automatically delayed.
MaBoMo restarted on 28 October. The model uses the 24 October rig incident date as a proxy for the start of the historical shutdown and assumes four outage days. Scheduled maintenance remains in the production baseline. Cost allowances and capex deferrals can be changed separately. No resource write-off, insurance proceeds or wreck-removal cost allocation is assumed.
Price deck, sales & cash conversion
The 2026 reference of $97.61/bbl blends reported sales through October with the remaining Q4 price assumptions. The 2027 input is $96.7401/bbl, based on 23 October monthly ICE quotes. The 2028–2030 inputs are $76, $77 and $78. These are dated model inputs. Use the flat-price button to apply the 2027 input to later years.
Reported proceeds through October are fixed across cases. November and December price assumptions retain the workbook’s 96% realisation factor and a 60%/40% split of remaining cargoes. September crude stock and forecast Q4 entitlement constrain liftings. Tax, operating costs, hedge settlements and cash flow remain estimates pending the 18 November results. Cash distributions from 2028 use 50% of prior-year FCFE, constrained by liquidity.
Sources, dates & design credits
- NHG financial model refreshed with the 4 November trading statement. Panoro, 4 November 2026 ↗
- Panoro: Dussafu rig incident, 25 October 2026. Initial incident disclosure; superseded on operating status by the 29 October BWE report. No operational live feed.
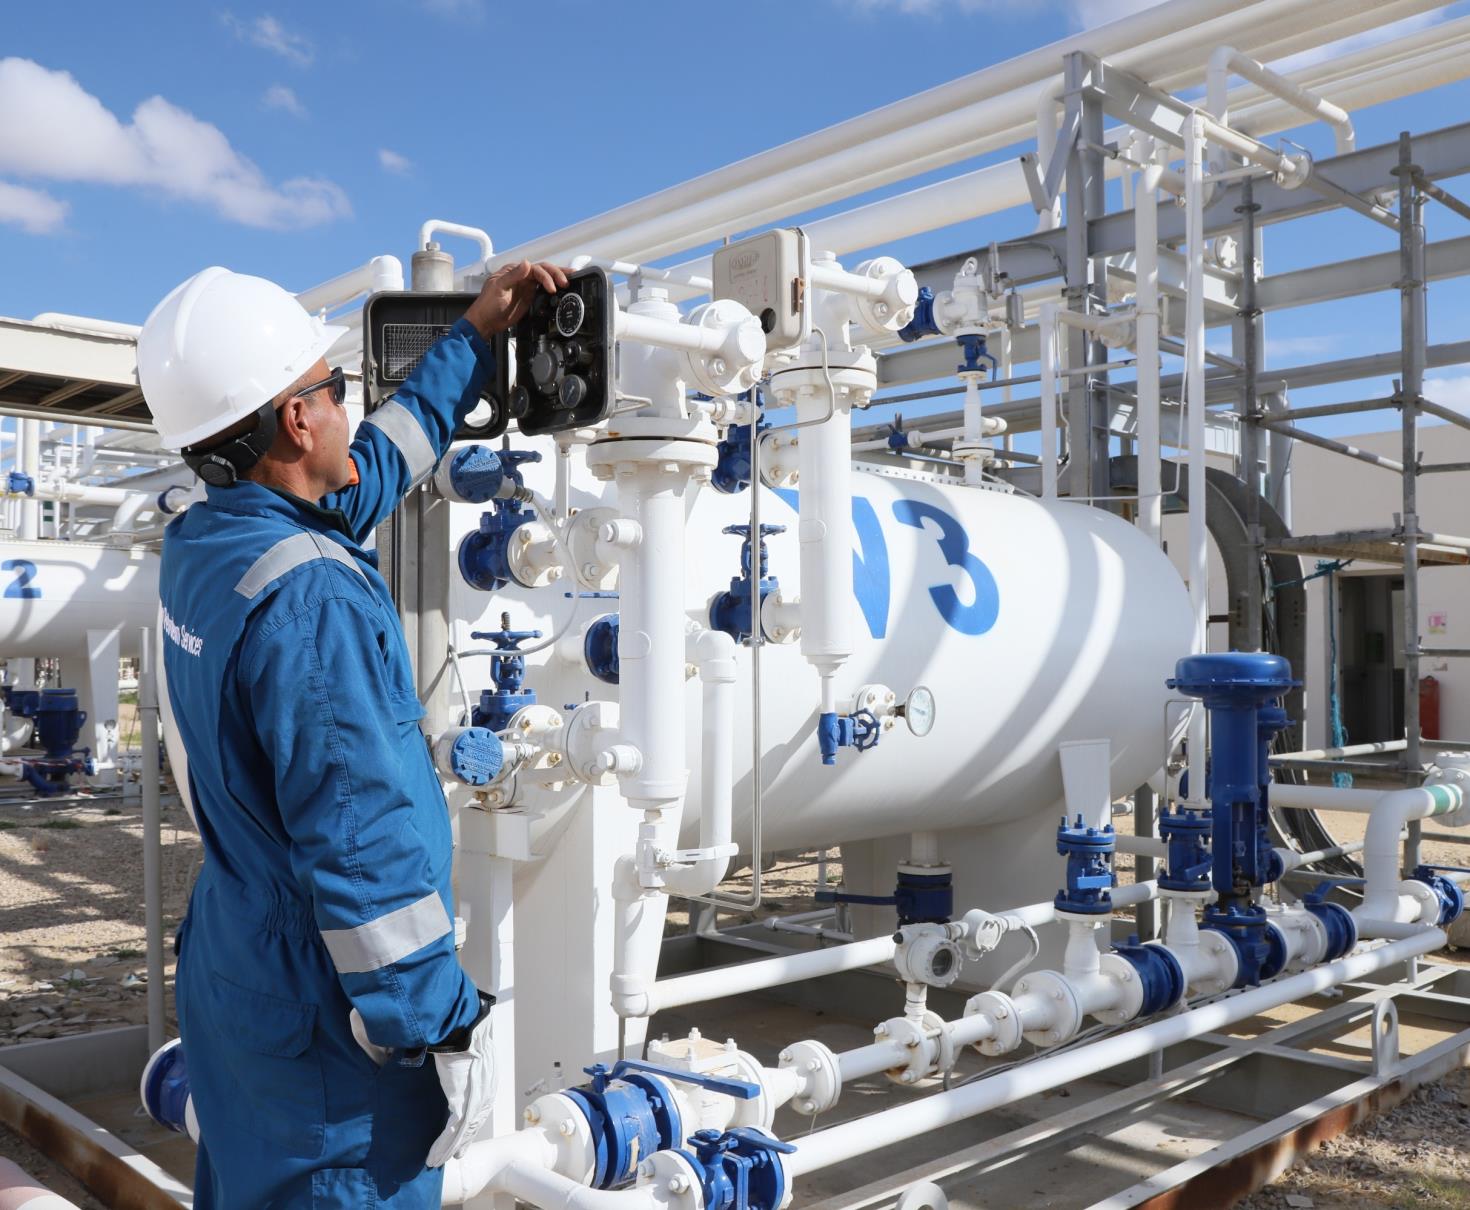
- Panoro: Pareto Energy Conference, 16 September 2026, via Quartr. Navy/orange palette, company wordmark and operational image are taken from the presentation. The slides predate the incident.
- Panoro H1 2026 report via Quartr, cited in the source workbook.
- BW Energy Q3 report, 29 October 2026, via Quartr. Confirms 28 October production restart, planned hydraulic workover and unresolved drilling timing.
- Bourdon: Q1 2028 first-oil target remains subject to drilling plans. Akoum platform financing and partner-shared lease costs are disclosed; no separate capex saving is booked before Panoro cash-call and lease terms are confirmed.
- Dashboard market references as of 4 November 2026 are NOK 30.50 per share and NOK 9.25 per USD. Both are editable.
- NHG masthead and golden-boar mark: the same assets used in the DNO dashboard. Presentation materials sourced from Quartr; forecasts and added restart lead time are NHG/dashboard assumptions.